
In this article, we will outline three different types of profitability analysis that should be on the radar of every CFO, senior controller or FP&A specialist. The essence of our recommendation is that profitability analysis is about more than identifying and monitoring one KPI. It is about understanding and diagnosing your organization’s profitability, and learning which levers, dials and needles you need to push.
How does a business typically examine its profitability?
Profitability analysis is an activity performed in businesses and organizations to determine how profitability is related to different dimensions. Typically this involves accounting calculations to determine how profitable a specific customer, product, or season is, for example.
Profitability analysis is a cornerstone of any enterprise finance department. The goal of the organization is to generate profits over time. For financial departments, understanding profitability, not just on a bottom-line number level, but understanding the pushes, pulls and cost levers that lead to the final number, is key.
6 types of profitability analysis
Profitability analysis can be looked at along different lines. It depends where you put the lens. 6 kinds of profitability analyses that may be taken at enterprise level include:
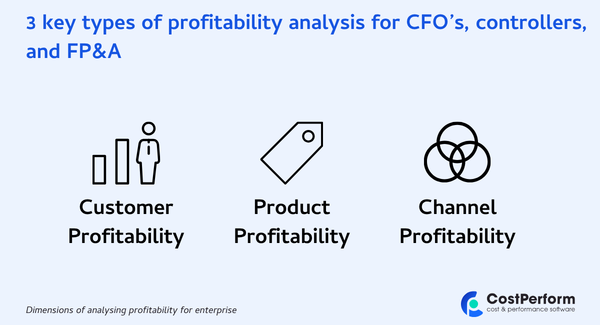
Customer Profitability: In essence, looking at who drives your profitability. Which customers are the most profitable?
Product Profitability: Identifying which offerings contribute to (and destroy) profitability. Which products are consuming an outsized amount of costly resources?
Channel Profitability: Routes to market with similar revenue ratios can carry differing profitabilities. Should I open or close branches? Or reexamine the balance between retail trading and online?
Seasonal Profitability: How are peak trading periods (and less busy periods) affecting profitability? How do margins compare across timeframes?
Business Unit Profitability: Which area of your business impacts profitability the most? Which BUs are under or over performing?
Location Profitability: How profitable are specific units over others? Are there certain locations where I should invest to increase sales or try to reduce cost to serve?
Benefits/importance of profitability analysis
Profitability analysis is important because it helps the business to make correct decisions. They have to be fully informed on the total costs, direct and indirect of each product, department, channel or customer to make correct decisions. A healthy underlying revenue and overall growth can mask severely underperforming departments, products, or channels.
Jamie Dimon, CEO of JP Morgan reveals that even the biggest bank in the United States is no exception to this. In the following clip, Dimon reveals that the retail bank wing of JPMorgan was subsidizing the investment bank to the tune of billions of dollars. “I’m still quite sensitive about that misallocation”, he says in a 2024 interview.
Drilling deep into profitability, through each of the three key dimensions mentioned earlier, can reveal an opportunity or hidden cost worth billions. Inefficiencies can exist at scale, masked by growth in other wings of the organization, or an insufficient understanding of the true profitability drivers.
An Example of Profitability Analysis in Business
A Dutch entrepreneur created a restaurant chain serving high-end, made-to-order bowls and salad wraps. The chain quickly gained popularity allowing the owner to rapidly expand her operation from one location to 12 locations in 5 cities in the space of a few years.
Since business was good, and overall margins remained healthy, the entrepreneur successfully received finance and backing to scale her operation, opening branches in 5 cities throughout the country.
As the operation grew, it became apparent that some branches were outperforming others. Busy city centre outlets attracted significantly more footfall (and revenue) than more peripheral locations.
The entrepreneur decided to engage in a profitability analysis exercise on the aspect location. She considered the following factors, among others:
- Marketing budget had a large fixed component, and separate regional components. Each city added to the business required regional marketing resources.
- With food supply and distribution, she benefitted from economies of scale, and increased bargaining power, but only slightly. She noted that with several of her suppliers there was no relative advantage to operating two restaurants, or twelve.
- Labour supply differed depending on the city. The cost of recruiting and retaining staff was higher in more competitive cities.
With that in mind, she split her business into different Business Units, one for each city she operated in, regardless of how many branches there were per city.
How profitability analysis influences decisions
She determined that the locations in City B and City C were responsible for 110% of her profitability, despite accounting for just 60% of revenues. The three branches in City A were at breakeven point, while the branches in City D were identified as a drain on profitability.
The entrepreneur decided, for business reasons, that City A, as her home city, and containing the flagship store, should remain operational. She decided to close all the branches in City D based on the profitability analysis.
This exercise resulted in a reduced overall revenue, as 3 of the 12 locations were closed, but without carrying the drag of the unprofitable City D.
How to run a profitability analysis
Getting a profitability analysis done right is something CostPerform has been doing for 25 years. In principle, the journey starts with visibility. Collecting the right enterprise data, building an accurate model, and turning the information to insight that is presented to the right stakeholder at the right time, are all complex questions. The answer to these questions varies from organization to organization.
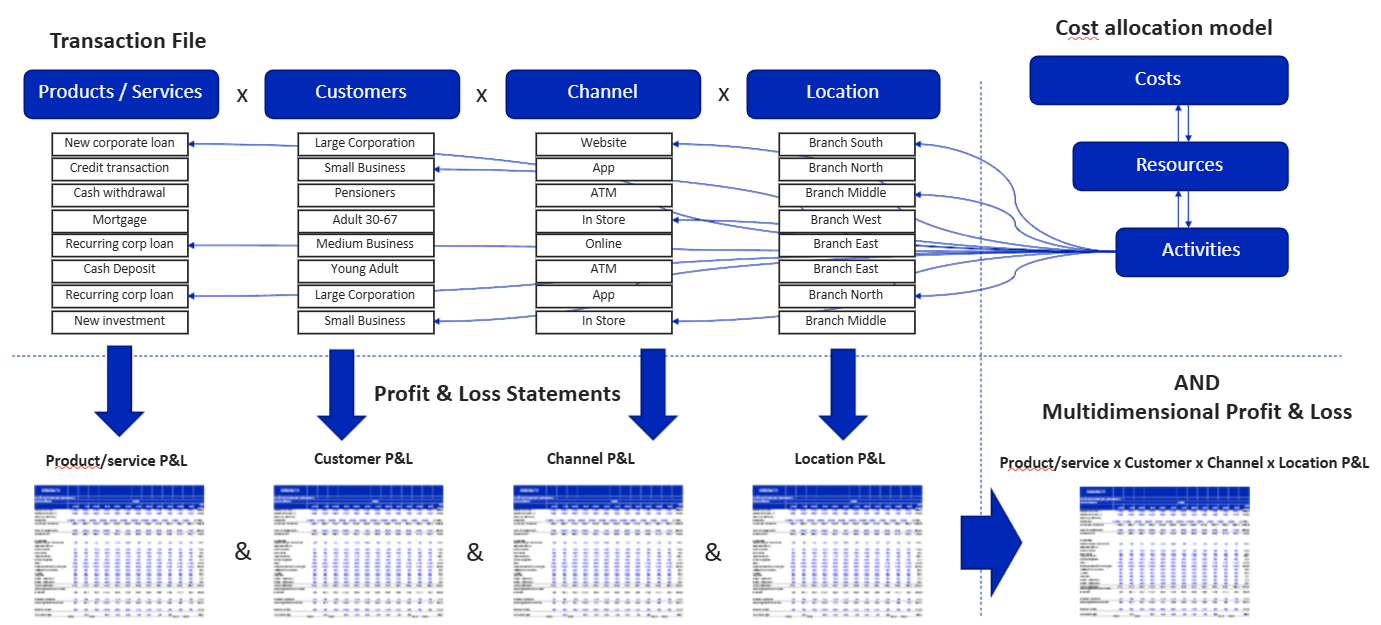
That variation is why many organizations reach for dedicated profitability analysis software rather than spreadsheets — a model that adapts to your dimensions, rather than a template you have to bend your business to fit.
Continue reading in-depth, such as how CostPerform builds a Multidimensional cost model like the one visualized above, by downloading our profitability analysis whitepaper below…