Getting the most out of Microsoft’s data visualization tool PowerBI
PowerBI is one of the most used tools by enterprise finance teams. PowerBI is deployed as a dashboarding and data visualization tools by financial teams. However, to output valuable insights, Power BI needs an “engine” to serve it the right data.
CostPerform is an enterprise cost modeling and cost allocation software. The tool is focused on mapping, and analyzing financial data for organizations in Financial Services, telecoms and beyond.
CostPerform specializes in connecting with PowerBI in order to create a robust enterprise finance data and visualization suite. Below, we outline exactly how CostPerform connects to PowerBI, allowing enterprise finance teams to get the most out of their PowerBI financial suite.
PowerBI: Key Integrations for Financial Teams
So here’s how to connect CostPerform to PowerBI, creating a best practice eco-system
Step 1. Get your financial data warehouse in order.
Modern finance teams use data warehouse solutions like Snowflake or Microsoft Azure. In order to get the most of PowerBI, financial and accounting teams need to have their data warehouse up to speed, with the correct data. A good data warehouse for an enterprise finance team has the following traits:
- Data Quality & Consistency
- Data Integration (our focus in this article)
- Scalability & Performance
Step 2. Connect CostPerform to your data warehouse.
Use built-in data warehouse functions to connect CostPerform to your data warehouse. You can export all data for objects, allocations, and breakdowns into a single, structured table. This is an essential step towards getting the most out of PowerBI for finance teams.
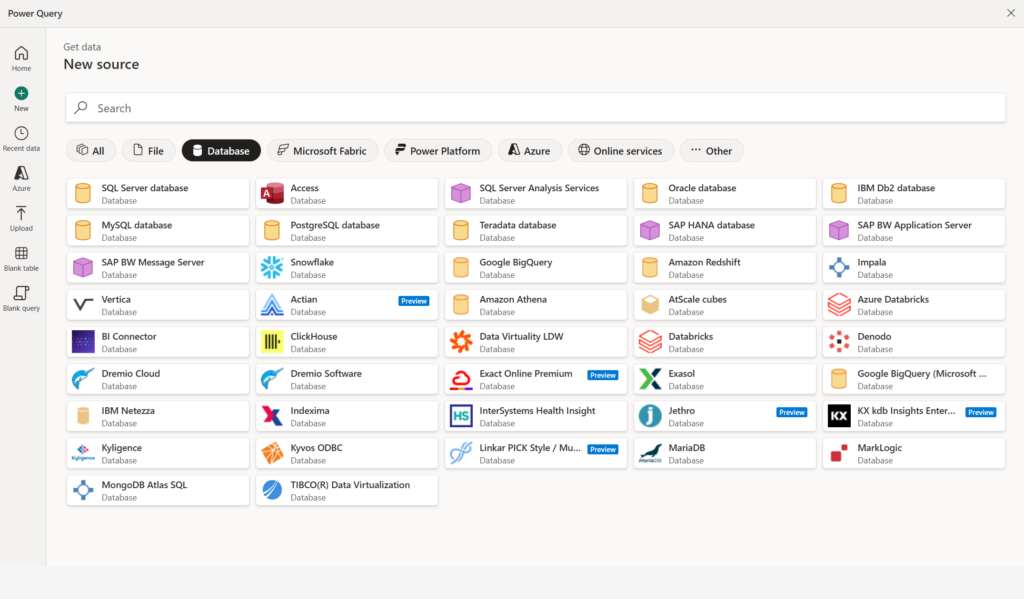
Step 3. Connect PowerBI directly to your data warehouse.
Via the “Get Data” menu tab, or when creating a new project in Power BI, finance teams can create the connection to their data warehouse. Under this menu, you can connect directly to Snowflake, Microsoft Azure, or Redshift. It is also possible to create a custom connection using server details.
Step 4. Get accurate and live financial dashboards in PowerBI.
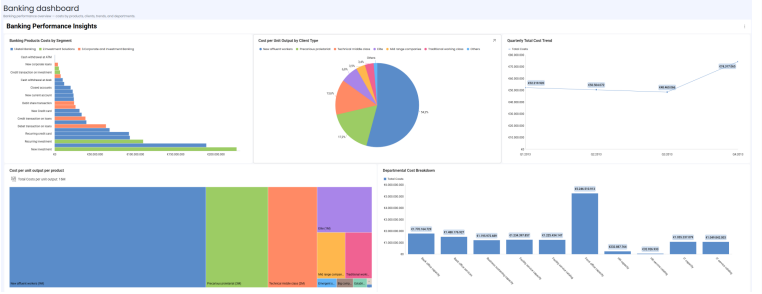
After connecting both PowerBI and CostPerform to your data warehouse, finance teams can view live insights, with data processed in the back-end by the CostPerform engine, and visualized in PowerBI. Finance teams can create a strong, accurate and insightful interface that reveals the most important insights to enterprise finance teams at the right time.
CostPerform & PowerBI: A powerful duo
Using CostPerform & PowerBI together creates a powerful combination for finance teams operating in spaces like financial services, banking, telecoms, and even government. Financial accountants can get the most out of their PowerBI dashboards by ensuring they are filled with data of high quality and consistency.
CostPerform excels at creating this data, expertly modeling and allocating the costs of an organization with ease and accuracy. By connecting this data source to PowerBI via the data warehouse, finance teams can be sure that they are bringing the best insights, and decision-making support to their organizations.