Telecom cost modeling is complex. It needs clear coordination between technical and business areas. Each model must fit the operator or regulator. This applies whether they work locally or globally. It also matters if they manage services like mobile, broadband, IoT, or satellite. The diversity of offerings, network layers, and regulatory pressures demands bespoke modeling strategies that reflect internal objectives and cost visibility requirements across services, geographies, and business models.
Operators must accurately allocate direct and shared costs such as labor, transmission, infrastructure, licensing across services to uncover true cost-to-serve. Moreover, effective models link these costs directly to outcomes, enabling defensible and transparent reporting as well as margin analysis. As a result, this granularity helps operators avoid regulatory penalties while also uncovering optimization levers hidden within complex portfolios.
In such a dynamic industry, a strong profitability model is essential. It clarifies revenue streams, cost drivers, and overall financial performance. Below is an eight-step framework for a strategic telecom cost model:
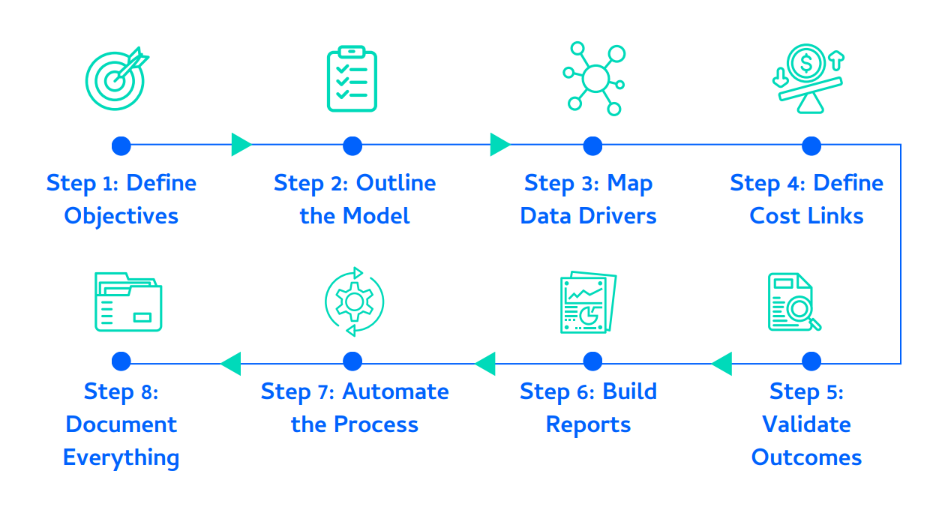
Step 1: Define Objectives
Begin with a clear understanding of what you want the model to deliver. Are you targeting profitability insights per subscriber, product (e.g., mobile, broadband, enterprise services), network segment, region, or partner? Do you want to measure profitability on a monthly or real-time basis, especially for prepaid services?
Every cost model must be driven by clearly defined outcomes. Common objectives include tracking service-level profitability across segments, modeling cost-to-serve by customer tier, complying with frameworks like LRIC, and benchmarking regional cost variances. Defining these goals ensures alignment between modeling design and business needs.
Step 2: Outline the Telecom Cost Modeling Framework
Start by mapping how revenue streams (e.g., ARPU, roaming fees, interconnection charges) and cost drivers (e.g., infrastructure, customer service, spectrum fees) interact. Build a cause-effect logic that links service consumption and infrastructure usage to financial outcomes. Drawing this out on paper or a whiteboard before transitioning to software helps refine assumptions early.
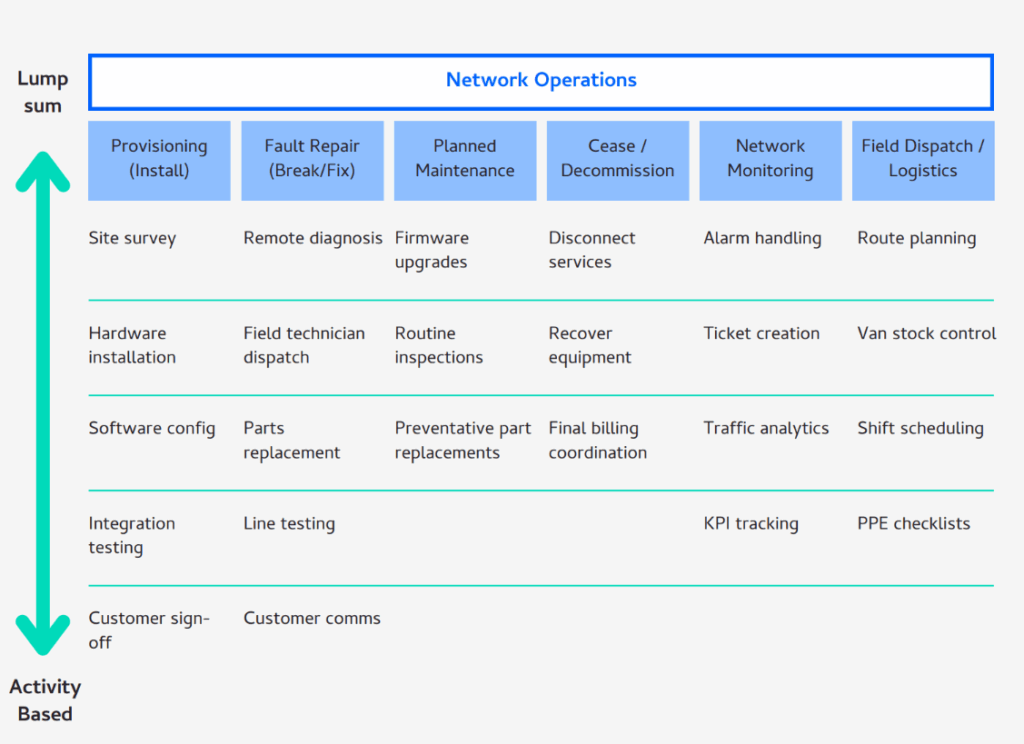
The above diagram shows that ABC is most effective when businesses identify the activities that are driving costs at a granular level, rather than attempt to apportion lump sum costs for entire departments.
Step 3: Map Data Drivers
Telecom environments involve large and diverse datasets: call detail records (CDRs), subscriber management systems, ERP (particularly general ledger and fixed asset registers), OSS/BSS data, billing records, and CRM databases. Identify which data is needed (e.g., usage by product, customer service interactions, tower-level cost data), data frequency and granularity (hourly, daily, monthly), and how to cleanse and normalize data for modeling use.
Step 4: Define Cost Links
Use a dedicated profitability modeling tool that handles high data volumes, complex cost allocations, and customizable rules (e.g., CostPerform, or a telecom-focused BI suite). Avoid general-purpose spreadsheets like Excel. They introduce scalability, transparency, and auditability issues, especially for telecom-scale operations.
Step 5: Validate Outcomes
After your first iteration, assess whether the model outputs align with operational and financial realities. For example, do results make sense at the tower, plan, or customer segment level? Are margins unusually high or low in specific products? Does the model reflect real network usage patterns? Iterate based on stakeholder feedback, operational benchmarks, and known financials.
Step 6: Build Reports
Turn model outputs into actionable dashboards and reports for different stakeholders. Executives need high-level profitability by product line and geography, network planners need cost-to-serve insights by infrastructure node, and marketing may want profitability by campaign or plan bundle. Use visualizations that highlight margins, trends, and anomalies clearly.
Step 7: Automate the Process
Given the volume and velocity of telecom data, automate. Data ingestion from OSS/BSS. Monthly or weekly model runs. Report generation and distribution. Automation ensures timeliness, reduces manual errors, and enhances decision-making agility.
“CostPerform has transformed our regulatory reporting, allowing us to deliver precise network component profitability analysis. What once took months is now streamlined, providing clear, actionable insights to manage costs more effectively.” – Martin Pallot, Finance Business Partner at JT Group.
Step 8: Document Everything
Keep a detailed record of model assumptions and logic, data sources and transformation processes, validation steps and known limitations, and change history and version control. This documentation is essential for audits, team changes, and model evolution.
Telecom providers who have followed this thoughtful, step-by-step approach have uncovered deep insights into their revenue streams, cost drivers, and profit levers. It transforms profitability modeling into a powerful tool for decision-making. While this framework isn’t a one-size-fits-all solution, it offers a solid foundation to start, learn, and adapt. Whether you’re building a model from scratch or refining an existing one, this clarity has led to smarter pricing, optimized resource allocation, and stronger competitive positioning in a rapidly evolving market.
If you’re curious how this eight-step approach helped Telekon Srbija with profitability and operations, watch the video below. Telekom Srbija uses CostPerform to gain clear visibility into operations and profitability, supporting new use cases, market expansion, and real-time efficiency insights through fast-tracked ETL.
Want to learn more?
Read on to get an overview on why CostPerform is the professional’s choice and see how it streamlines each of your 8 strategic modeling steps, or get directly in touch with us.